Start by importing all the packages you need. You need to have mplsoccer, matplotlib, highlight_text, seaborn, numpy and pandas. We are using open statsbomb data here so we need to also have statsbombpy installed. If you don't have them installed, please install them first. I am also using a folder of styles I poached from this github folder so please download it. For the font I use for my headers, download Cal Sans from here, put it in a folder named Cal Sans and add it to the fonts folder you have downloaded from Github.
Now let's get cracking.
Imports
Let's start by importing the packages we need and defining the colours we will use.
from statsbombpy import sb
import pandas as pd
import numpy as np
from mplsoccer import Pitch
from mplsoccer import VerticalPitch,Pitch,add_image
from PIL import Image
import urllib
from urllib.request import urlopen

from highlight_text import ax_text, fig_text
from matplotlib.colors import LinearSegmentedColormap
import matplotlib.patches as patches
from matplotlib.offsetbox import OffsetImage, AnnotationBbox
import matplotlib.pyplot as plt
import matplotlib.patheffects as path_effects
import seaborn as sns
import os
import matplotlib.font_manager as fm


line_color= '#00285E'
col1 = '#ff4b44'
col2 = '#00a0de'
That's all we need. We have:
- Statsbombpy to help us load the data from statsbomb
- Mplscoccer to draw the pitch
- Matplotlib and seaborn to plot the graphs from the data
- Pandas and numpy to process the data
- highlight_text for the headers
Importing the styles and fonts.
font_path = "assets/fonts" #link to your font files
for x in os.listdir(font_path):
    for y in os.listdir(f"{font_path}/{x}"):
        if (y.split(".")[-1] == "ttf") or (y.split(".")[-1] == "otf"):
            fm.fontManager.addfont(f"{font_path}/{x}/{y}")
            try:
                fm.FontProperties(weight=y.split("-")[-1].split(".")[0].lower(), fname=y.split("-")[0])
            except Exception:
                continue

plt.style.use("assets/sylesheets/soc_base.mplstyle") #link to your stylesheets
The above function goes through your folder and looks for all the instances of font files i.e files ending with "tff" and "otf" and adds them to the current instance of the font manager. We also import the soc_base.mplstyle file where our base styles are.
Importing the data from statsbomb.
I am importing the data for WEURO 2025 here and you are free to do this if you want to work on another tournament that statsbomb has data for.
grouped_events = sb.competition_events(
    country="Europe",
    division= "UEFA Women's Euro",
    season="2025",
    gender="female"
)
This gives us all the event data for all the games in the tournament and assigns it to our variable grouped_events. Next we need to process the data.
Processing the data.
Statsbomb data comes with coordinates in the same column so we need to separate x and y values for every event. Shots also have a z value on top of the x and y but some shots only have an x and y value (for example shots that are blocked) so we need to make sure we get the correct value for each of x, y and z. I do that by adding a z value of np.nan (which is basically None in python or NaN in Javascript) at the end of every variable without a z value so that every variable now has 3 values (with None being the value of the z variable wherever we don't have one.
For all those who don't know, the z variable is where the ball ends up in the air from the shot at the point it crosses the line.
grouped_events[['x', 'y']] = grouped_events['location'].apply(pd.Series)
grouped_events[['pass_end_x', 'pass_end_y']] = grouped_events['pass_end_location'].apply(pd.Series)
grouped_events[['carry_end_x', 'carry_end_y']] = grouped_events['carry_end_location'].apply(pd.Series)
#split the shot_end_locations into x,y and z components (some don't include the z-part)
grouped_events['shot_end_location_x'], grouped_events['shot_end_location_y'], grouped_events['shot_end_location_z'] = np.nan, np.nan, np.nan
end_locations = np.vstack(grouped_events.loc[grouped_events.type == 'Shot'].shot_end_location.apply(lambda x: x if len(x) == 3
                                       else x + [np.nan]).values)
grouped_events.loc[grouped_events.type == 'Shot', 'shot_end_location_x'] = end_locations[:, 0]
grouped_events.loc[grouped_events.type == 'Shot', 'shot_end_location_y'] = end_locations[:, 1]
grouped_events.loc[grouped_events.type == 'Shot', 'shot_end_location_z'] = end_locations[:, 2]
So to recap, our start point coordinates are x and y and our end point coordinates are shot_end_location_x, shot_end_location_y and shot_end_location_z.
Now let's get the penalty shots.
pen_shots_df=grouped_events[(grouped_events.type=="Shot")&(grouped_events.shot_type=="Penalty")]We have our shots now and have saved the dataframe to pen_shots_df. Now it's time to lay out some groundwork.
Please note that this is partly inspired by this analysis so be sure to support the author.
First of all we have a function to calculate the number of penalty shots in each direction i.e. penalties taken through the centre, to the left and to the right.
def calculation(df):
    pitch = VerticalPitch(half=True, corner_arcs=True, goal_type='box')

    dims = pitch.dim

    goal_line = dims.length
    left_zone_x_start = dims.penalty_area_top
    left_zone_x_end = (dims.goal_top + (dims.goal_width)/3)
    right_zone_x_end = dims.penalty_area_bottom
    right_zone_x_start = (dims.goal_bottom - (dims.goal_width)/3)
    left_near_post_x_start = (dims.goal_top - (dims.goal_width)/3)
    left_near_post_x_end = (dims.goal_top + (dims.goal_width)/3)
    right_near_post_x_start = (dims.goal_bottom - (dims.goal_width)/3)
    right_near_post_x_end = (dims.goal_bottom + (dims.goal_width)/3)

    # left sided penalties
    left_shots = df[(df['type']=='Shot') & (df['shot_type']=='Penalty') &
                    (df['shot_end_location_y']>left_near_post_x_start) & (df['shot_end_location_y']<left_near_post_x_end) &
                    (df['shot_end_location_x']>117) & (df['shot_end_location_x']>80)].drop_duplicates(subset=['id'], keep='first')

    # right sided penalties
    right_shots = df[(df['type']=='Shot') & (df['shot_type']=='Penalty') &
                    (df['shot_end_location_y']>right_near_post_x_start) & (df['shot_end_location_y']<right_near_post_x_end) &
                    (df['shot_end_location_x']>117) & (df['shot_end_location_x']>80)].drop_duplicates(subset=['id'], keep='first')

    # central penalties
    central_shots = df[(df['type']=='Shot') & (df['shot_type']=='Penalty') &
                    (df['shot_end_location_y']>left_near_post_x_end) & (df['shot_end_location_y']<right_near_post_x_start) &
                    (df['shot_end_location_x']>117) & (df['shot_end_location_x']>80)].drop_duplicates(subset=['id'], keep='first')


    total_right = len(right_shots)
    total_left = len(left_shots)
    total_central = len(central_shots)

    return total_left, total_central, total_right
then the function to plot the penalties, labelling the goals and the shots missed.
def plot(df, ax):
    pitch = VerticalPitch(half=True, goal_type='box', pad_bottom=-40, pad_left=-15, pad_right=-15)
    pitch.draw(ax=ax)

    dims = pitch.dim

    goal_line = dims.length
    left_zone_x_start = dims.penalty_area_top
    left_zone_x_end = (dims.goal_top + (dims.goal_width)/3)
    right_zone_x_end = dims.penalty_area_bottom
    right_zone_x_start = (dims.goal_bottom - (dims.goal_width)/3)
    left_near_post_x_start = (dims.goal_top - (dims.goal_width)/3)
    left_near_post_x_end = (dims.goal_top + (dims.goal_width)/3)
    right_near_post_x_start = (dims.goal_bottom - (dims.goal_width)/3)
    right_near_post_x_end = (dims.goal_bottom + (dims.goal_width)/3)

    # light fills
    ax.fill_between([left_zone_x_start+9, left_zone_x_end], goal_line, (goal_line)*5.1/6, color=col1, alpha=0.1, zorder=10, ls='dashed', lw=2)
    ax.fill_between([right_zone_x_start, right_zone_x_end-9], goal_line, (goal_line)*5.1/6, color=col2, alpha=0.1, zorder=10, ls='dashed', lw=2)

    # edge fills
    ax.fill_between([left_zone_x_start+9, left_zone_x_end], goal_line, (goal_line)*5.1/6, color='None', alpha=1, zorder=10, ls='dashed', lw=2,  ec=col1)
    ax.fill_between([right_zone_x_start, right_zone_x_end-9], goal_line, (goal_line)*5.1/6, color='None', alpha=1, zorder=10, ls='dashed', lw=2,  ec=col2)

    # near/far post lines
    ax.hlines(y=goal_line, xmin=left_near_post_x_start, xmax=left_near_post_x_end, color=col1, linestyle='-', linewidth=7.5, zorder=11)
    ax.hlines(y=goal_line, xmin=right_near_post_x_start, xmax=right_near_post_x_end, color=col2, linestyle='-', linewidth=7.5, zorder=11)

    # left sided penalties
    left = df[(df['type']=='Shot') & (df['shot_type']=='Penalty') &
                    (df['shot_end_location_y']>left_near_post_x_start) & (df['shot_end_location_y']<left_near_post_x_end) &
                    (df['shot_end_location_x']>117) & (df['shot_end_location_x']>80)].drop_duplicates(subset=['id'], keep='first')
    left_shots = left[left['shot_outcome']!='Goal']
    left_goals = left[left['shot_outcome']=='Goal']

    ax.scatter(left_shots.y, left_shots.x, s=50, color='w', edgecolor='k', zorder=3)
    pitch.lines(left_shots.shot_end_location_x, left_shots.shot_end_location_y, left_shots.x, left_shots.y, comet=True, transparent=True,
                color='#FFC758', alpha=0.25, lw=2.5, zorder=2, ax=ax)
    pitch.lines(left_goals.shot_end_location_x, left_goals.shot_end_location_y, left_goals.x, left_goals.y, comet=True, transparent=True,
                color='#EE3124', alpha=0.25, lw=2.5, zorder=2, ax=ax)

    # right sided penalties
    right = df[(df['type']=='Shot') & (df['shot_type']=='Penalty') &
                    (df['shot_end_location_y']>right_near_post_x_start) & (df['shot_end_location_y']<right_near_post_x_end) &
                    (df['shot_end_location_x']>117) & (df['shot_end_location_x']>80)].drop_duplicates(subset=['id'], keep='first')
    right_shots = right[right['shot_outcome']!='Goal']
    right_goals = right[right['shot_outcome']=='Goal']


    ax.scatter(right_shots.y, right_shots.x, s=50, color='w', edgecolor='k', zorder=3)
    pitch.lines(right_shots.shot_end_location_x, right_shots.shot_end_location_y, right_shots.x, right_shots.y, comet=True, transparent=True,
                color='#FFC758', alpha=0.25, lw=2.5, zorder=2, ax=ax)
    pitch.lines(right_goals.shot_end_location_x, right_goals.shot_end_location_y, right_goals.x, right_goals.y, comet=True, transparent=True,
                color='#EE3124', alpha=0.25, lw=2.5, zorder=2, ax=ax)

    # central penalties
    central = df[(df['type']=='Shot') & (df['shot_type']=='Penalty') &
                    (df['shot_end_location_y']>left_near_post_x_end) & (df['shot_end_location_y']<right_near_post_x_start) &
                    (df['shot_end_location_x']>117) & (df['shot_end_location_x']>80)].drop_duplicates(subset=['id'], keep='first')
    central_shots = central[central['shot_outcome']!='Goal']
    central_goals = central[central['shot_outcome']=='Goal']

    ax.scatter(central_shots.y, central_shots.x, s=50, color='w', edgecolor='k', zorder=3)
    pitch.lines(central_shots.shot_end_location_x, central_shots.shot_end_location_y, central_shots.x, central_shots.y, comet=True, transparent=True,
                color='#FFC758', alpha=0.25, lw=2.5, zorder=12, ax=ax)
    pitch.lines(central_goals.shot_end_location_x, central_goals.shot_end_location_y, central_goals.x, central_goals.y, comet=True, transparent=True,
                color='#EE3124', alpha=0.25, lw=2.5, zorder=12, ax=ax)

    np_shots = pd.concat([left_shots, right_shots, central_shots])
    goals = np_shots[np_shots['shot_outcome']=='Goal']
    pitch.lines(goals.shot_end_location_x, goals.shot_end_location_y, goals.x, goals.y, comet=True, transparent=True,
                color='#EE3124', alpha=0.25, lw=2.5, zorder=4, ax=ax)


    ax.text(left_zone_x_start+5, (goal_line*5.1/6) - 3.5, f"Left Side\nTaken: {len(left)}  Scored: {len(left_goals)}", color=col1, fontsize=20, ha='center', va='center')
    ax.text(left_zone_x_end+1, (goal_line*5.1/6) - 3.5, f"Central\nTaken: {len(central)}  Scored: {len(central_goals)}", color=line_color, fontsize=20, ha='center', va='center')
    ax.text(right_zone_x_end-5, (goal_line*5.1/6) - 3.5, f"Right Side\nTaken: {len(right)}  Scored: {len(right_goals)}", color=col2, fontsize=20, ha='center', va='center')


    return
Now to the fun part. Let's plot the viz.
total_left, total_central, total_right = calculation(pen_shots_df)
left = round((total_left/(total_left+total_central+total_right))*100)
central = round((total_central/(total_left+total_central+total_right))*100)
right = round((total_right/(total_left+total_central+total_right))*100)
fig, ax = plt.subplots(figsize=(10,10))
plot(pen_shots_df, ax)

# fig.text(0.025, 1.05, pname, fontsize=35, fontweight='bold')
# fig.text(0.025, .8, 'WEURO 2025 Penalty Analysis  Data: Statsbomb', fontsize=20)
# # fig.text(0.025, 1.02, '', fontsize=20)
fig_text(
    x = 0.2, y = .75,
    s = "WEURO 2025 Penalty Analysis",
    va = "bottom", ha = "left",
    fontsize = 30, color = line_color, weight = "bold", family='Cal Sans'
)

fig_text(
	x = 0.2, y = .72,
    s = "All Penalties <scored> and <missed> incl shootouts",
    highlight_textprops=[{'color':'#EE3124'}, {'color':'#FFC758'}],
	va = "bottom", ha = "left",
    # fontstyle="italic",
	fontsize = 16, color ='gray'
)

fig_text(
	x = 0.76, y = .18,
    s = "Viz by @woso_analytics. Data from Statsbomb",
	va = "bottom", ha = "center",
    fontstyle="italic",
	fontsize = 10, color=line_color, family='DM Sans'
)


plt.tight_layout()

fotmob_url = 'https://images.fotmob.com/image_resources/logo/leaguelogo/292.png'
club_icon = Image.open(urllib.request.urlopen(f'{fotmob_url}'))
ax_timage = add_image(club_icon, fig, left=0.07, bottom=0.74, width=0.060, height=0.060)

plt.savefig("figures/weuro_penalties.png", dpi=600, facecolor="#EFE9E6", bbox_inches="tight", transparent=False)
plt.savefig("figures/weuro_penalties_tr.png", dpi=600, facecolor="none", edgecolor="none", bbox_inches="tight", transparent=True)You can save your file wherever you want but in my case I created a figures folder in the folder I was working in so be sure to create one for the last lines of code to work.
Your resulting image should look like this (alongside a transparent version).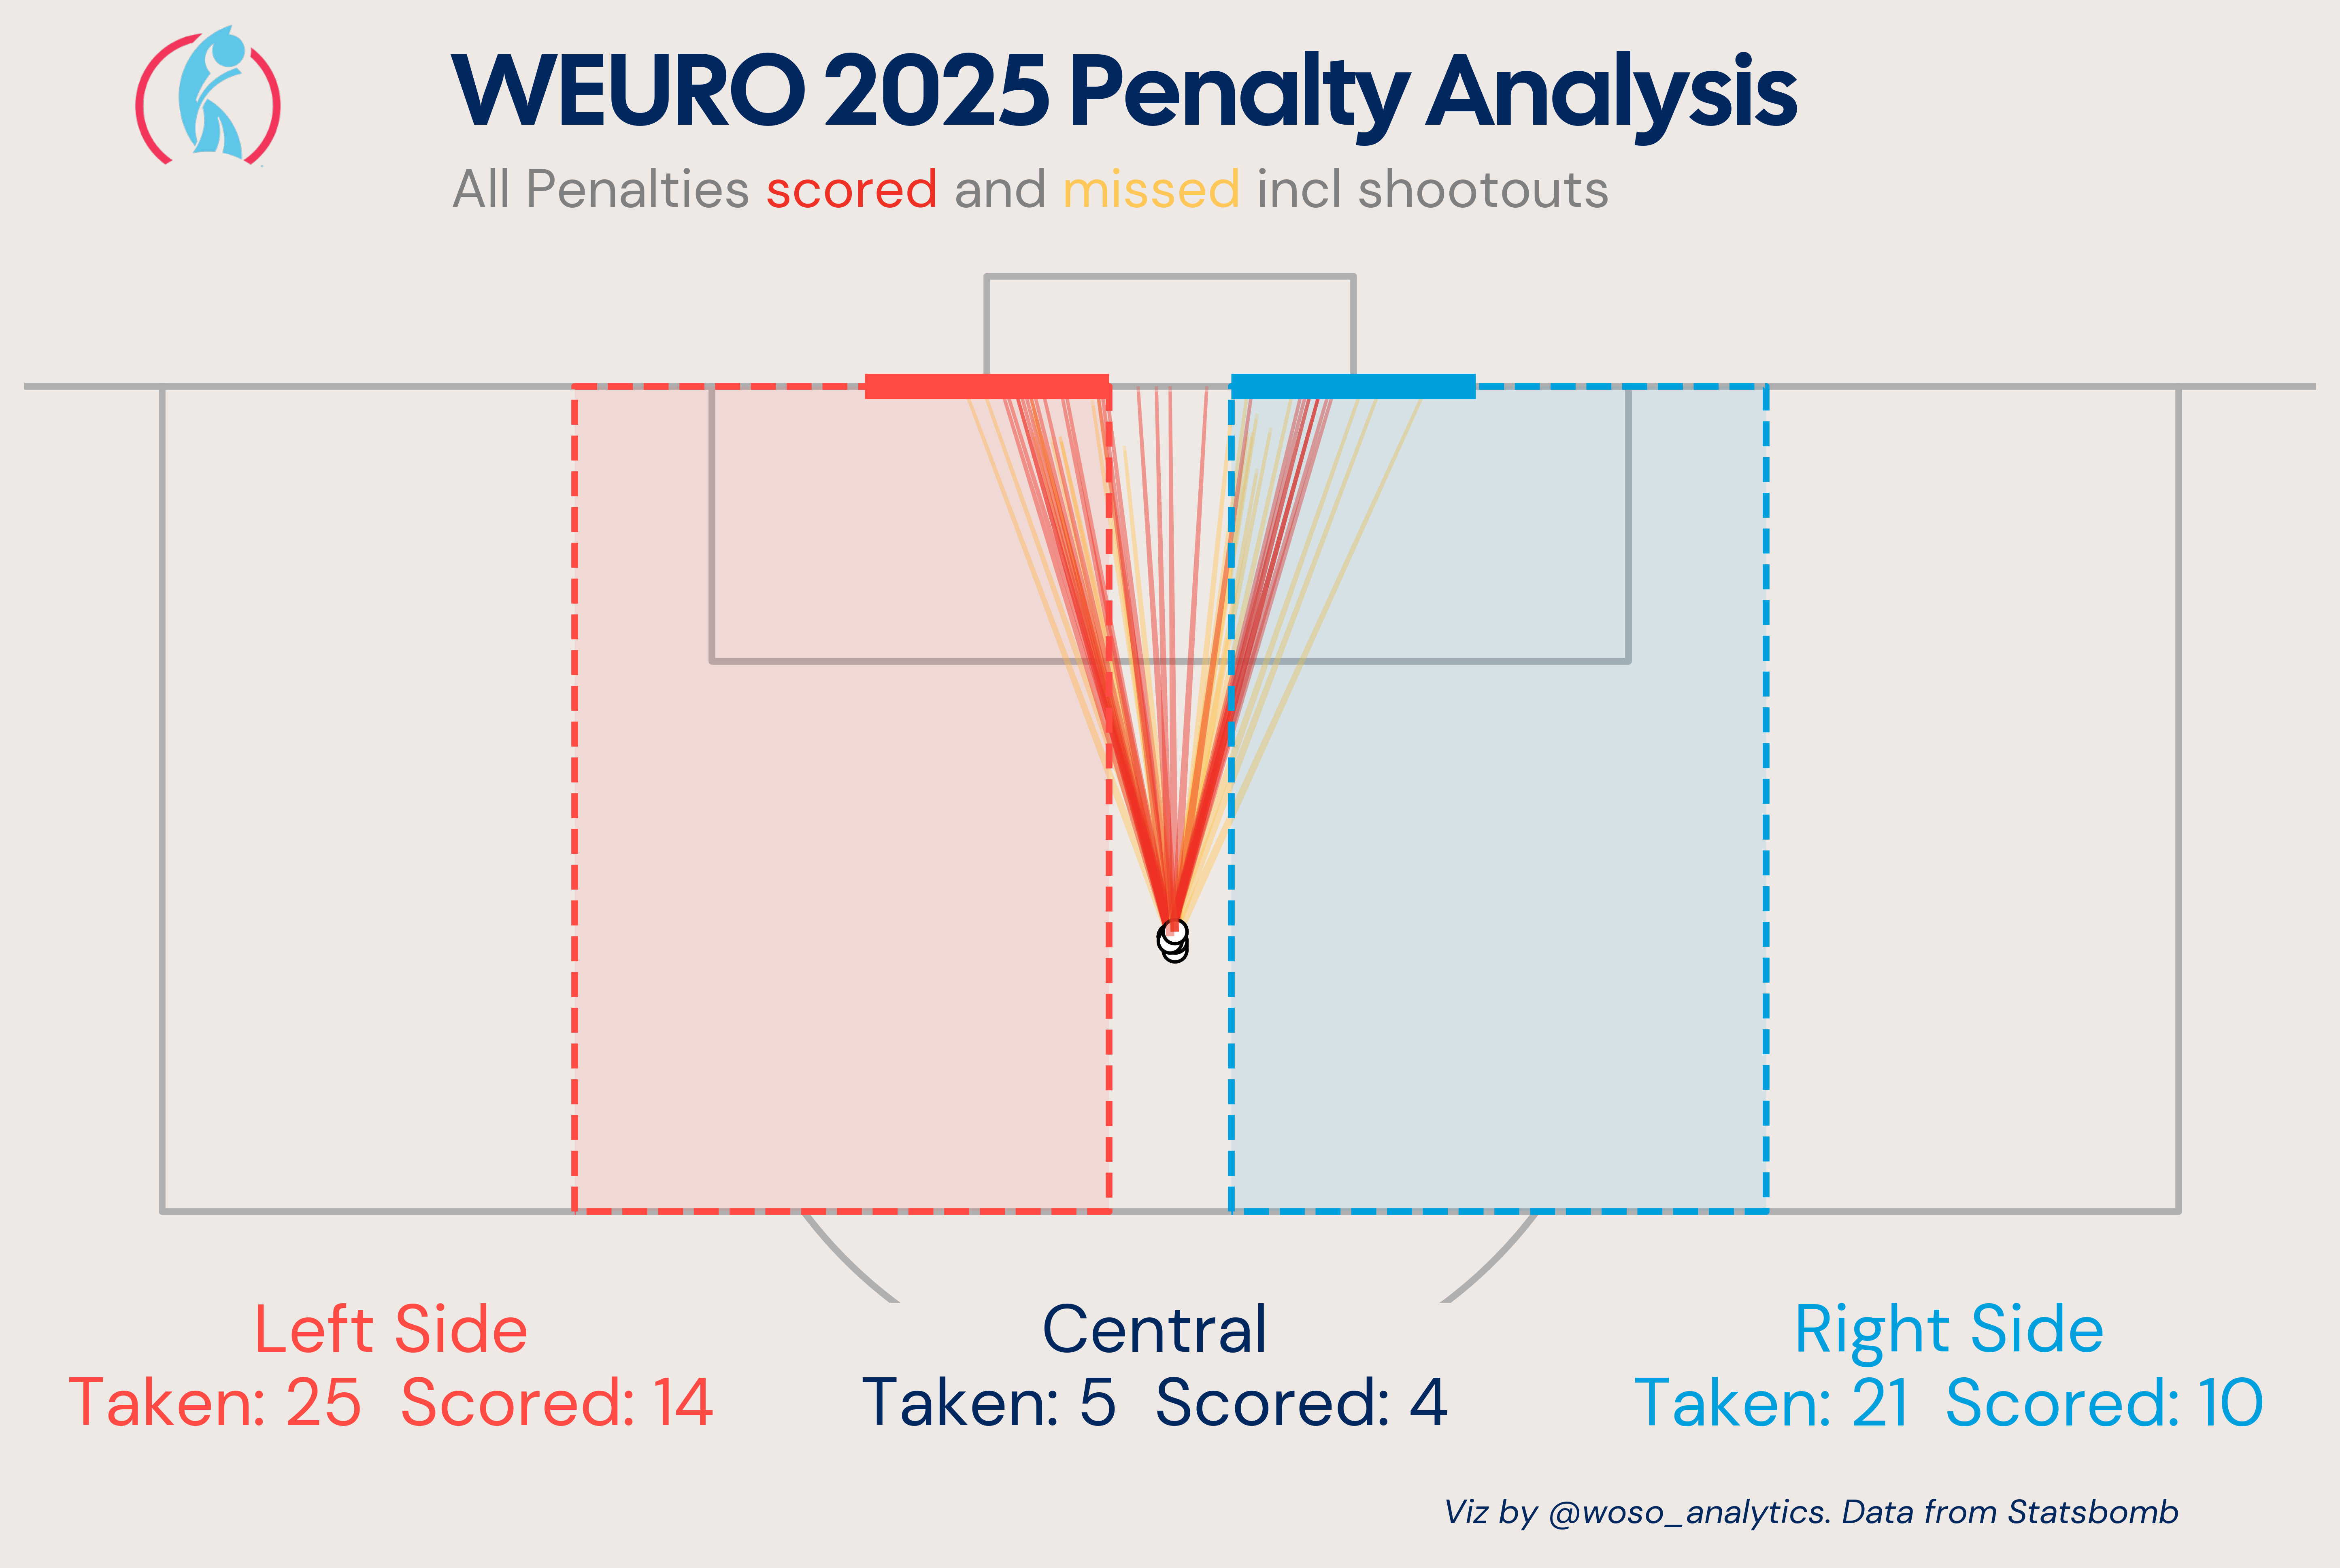
Plot the goalmouth version.
A function to plot the goalmouth.
def draw_goalmouth(ax, x=36, y=0, goal_width=8, goal_height=2.67,
                    net_lines=6, post_color='#00285E', net_color='lightgray'):


    # vertical posts
    post_width = 0.1
    left_post = patches.Rectangle((x, y), post_width, goal_height,
                                  color='None', zorder=3, ec='#00285E', lw=1.5)
    right_post = patches.Rectangle((x + goal_width - post_width, y),
                                   post_width, goal_height, color='None', zorder=3, ec='#00285E', lw=1.5)

    # horizontal post
    crossbar = patches.Rectangle((x, y + goal_height - post_width),
                                 goal_width, post_width, color='None', zorder=3, ec='#00285E', lw=1.5)

    ax.add_patch(left_post)
    ax.add_patch(right_post)
    ax.add_patch(crossbar)

    # vertical net lines
    x_lines = np.linspace(x + post_width, x + goal_width - post_width, net_lines)
    for xi in x_lines:
        ax.plot([xi, xi], [y, y + goal_height - post_width],
                color=net_color, linewidth=0.6, zorder=1)

    # horizontal net lines
    y_lines = np.linspace(y, y + goal_height - post_width, net_lines)
    for yi in y_lines:
        ax.plot([x + post_width, x + goal_width - post_width], [yi, yi],
                color=net_color, linewidth=0.6, zorder=1)


    ax.set_xlim(x - 2, x + goal_width + 2)
    ax.set_ylim(y - 0.5, y + goal_height + 0.5)
    ax.set_aspect('equal')
    ax.axis('off')

    ax.vlines(38.7, 0, 2.6, colors='#FFC758', linestyles='--')
    ax.vlines(41.3, 0, 2.6, colors='#FFC758', linestyles='--')

    # Define y-coordinates
    y = np.linspace(0, 2.59)

    # Define x-coordinates for the two vertical lines
    x = 36
    x1 = 38.7  # First vertical line at x=2
    x2 = 41.3  # Second vertical line at x=7
    x3 = 44
    # Fill the area between the two vertical lines
    ax.fill_betweenx(y, x, x1, color='#EE3124', alpha=0.1)
    ax.fill_betweenx(y, x1, x2, color='#FFC758', alpha=0.1)
    ax.fill_betweenx(y, x2, x3, color='#6CADDF', alpha=0.1)

    return ax
The we finally plot the goalmouth version.
df_penalty = pen_shots_df.copy()
df_penalty[['shot_end_location_x', 'shot_end_location_y', 'shot_end_location_z', 'shot_outcome']]
df_clean = df_penalty.dropna(subset=['shot_end_location_y', 'shot_end_location_z'])  # Remove shots with missing end location

# Create the figure and axis
fig, ax = plt.subplots(figsize=(10, 10))      # Create the matplotlib figure and axis


# Draw the goal
draw_goalmouth(ax)                               # Use the draw_goal function from goal_plot

# Plot each penalty shot as a scatter point
for i, row in df_clean.iterrows():          # Loop through each clean penalty shot
    color = '#00b4db' if row['shot_outcome'] == 'Goal' else '#ff4444'  # Blue for goal, red for miss
    if row['shot_outcome'] == 'Goal':
        marker = "o"                        # Use a circle for goals
        size = 100                          # Size of the point
    else:
        marker = 'x'                        # Use an X for missed shots
        size = 100

    # Scatter plot for each shot
    ax.scatter(row['shot_end_location_y'], row['shot_end_location_z'],  # Coordinates of the shot
               marker=marker, s=size, color=color, alpha=0.7,  # Style
               edgecolor='white')                              # White border for better visibility


fig_text(
    x = 0.22, y = .7,
    s = "WEURO 2025 Penalty Analysis",
    va = "bottom", ha = "left",
    fontsize = 30, color = line_color, weight = "bold", family='Cal Sans'
)

fig_text(
	x = 0.22, y = .67,
    s = "All Penalties <scored> and <missed> incl shootouts",
    highlight_textprops=[{'color':'#00b4db'}, {'color':'#ff4444'}],
	va = "bottom", ha = "left",
    # fontstyle="italic",
	fontsize = 16, color ='gray'
)

fig_text(
	x = 0.74, y = .3,
    s = "Viz by @woso_analytics. Data from Statsbomb",
	va = "bottom", ha = "center",
    fontstyle="italic",
	fontsize = 10, color=line_color, family='DM Sans'
)


plt.tight_layout()

fotmob_url = 'https://images.fotmob.com/image_resources/logo/leaguelogo/292.png'
club_icon = Image.open(urllib.request.urlopen(f'{fotmob_url}'))
ax_timage = add_image(club_icon, fig, left=0.12, bottom=0.69, width=0.060, height=0.060)

plt.savefig("figures/weuro_penalties_goalmouth.png", dpi=600, facecolor="#EFE9E6", bbox_inches="tight", transparent=False)
plt.savefig("figures/weuro_penalties_goalmouth_tr.png", dpi=600, facecolor="none", edgecolor="none", bbox_inches="tight", transparent=True)
The plot should look like this
and voila.. that's it. Fun stuff